
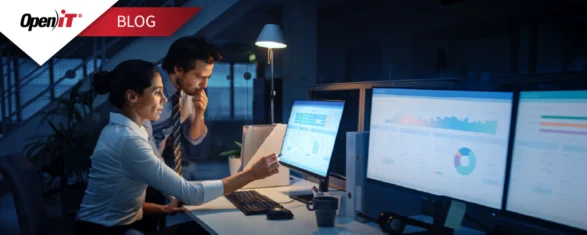

Améliorer l'efficacité des licences avec ServiceNow® SAM Pro et Open iT
Les licences d'ingénierie et de logiciels spécialisés sont coûteuses et complexes à gérer. Cette session explore comment l'intégration de ServiceNow Software Asset Management Professional (SAM Pro) avec Open iT vous donne les informations et le contrôle nécessaires pour optimiser l'utilisation, assurer la conformité et fournir une valeur commerciale mesurable.
- Seamless Integration: See how Open iT extends ServiceNow SAM Pro for deeper insights into engineering and specialized software.
- Technical Visibility: Unlock granular tracking and actionable intelligence for complex environments.
- Business Value: Turn technical data into cost savings, stronger ROI, and smarter planning.
8 octobre 2025
30
mins
WEBINAIRE À LA DEMANDE
Transcript
[0:01] Nix: Good morning, good afternoon or good evening everyone. Thank you for being here for today’s session driving license efficiency with ServiceNow SAM Pro and Open iT. I’m Nix, your host for this webinar. In the next 20 minutes, you’ll see how the combined power of ServiceNow software asset management professional or SAM Pro and Open iT delivers full spectrum visibility into your license environment, transforming raw usage data into smarter decisions, reduced waste, and measurable ROI. Feel free to submit your questions using the Q&A panel at the top of your screen.
[0:35] We’ll answer as many as we can during the live session, and we’ll follow up with you afterward if needed. Now, let me introduce today’s speaker. Malou is a solutions architect at Open iT’s Norway office with over a decade of experience in software development, business intelligence, and software asset management. She’s worked across multiple industries to help organizations optimize complex software environments, and turn usage data into real business outcomes. Let’s welcome Malou.
[1:09] Malou: Thank you, Nix. And welcome everyone. So today I would like to talk about these things with you. The first one is why ServiceNow and SAM Pro and Open iT integration is important, you know, what kind of business challenges it solves and what opportunities it unlocks. The second one is about the three visualization approach, different ways to view and use Open iT data inside ServiceNow for decision making, and then I will have a live demonstration for you to see the integration in action. I will also talk about the normalization and shared software asset directory. We’ll have a short recap and then we’ll have a Q&A at the end. Okay, so let’s dive in.
[2:05] Okay, I would like to start with a scenario that I think many of you will recognize. So in your organization, you probably run a mix of applications. You know, one side you have the universal business apps like Microsoft Office and SAP, Oracle, you know, that nearly everyone in the company uses. And then on the other hand you will have the more specialized engineering tools MathWorks, Autodesk, ANSYS, and other critical applications for design development etc., right? And in order to manage this application you also need to run two systems. You have ServiceNow for the visibility into business applications and you run Open iT LicenseAnalyzer™ for visibility into the engineering applications, and both of these tools are powerful. They both provide visibility but then there’s also a challenge because they both live in separate worlds, right?
[3:10] So usually the technical users are comfortable with Open iT and the nontechnical users, the managers, the executives, finance people, they spend their time in ServiceNow and, you know, working with other customers. We know that many people across the company could benefit from Open iT insights. But if you don’t integrate then you have to face two choices, right? The first one is either you train everyone to use Open iT which means extra investment in training, access management and support, and second is, you know, you keep the Open iT insights limited to a small group of technical users, and neither of these options will give you full value to your investment.
[4:02] Therefore it just makes sense to do the integration.
[4:08] Now with integration what we would like is to bring the Open iT data into ServiceNow and what it means is that first you can see both business and technical application in one platform. The data can be combined with other enterprise data or information that’s already in ServiceNow and the different stakeholders, IT, engineering, finance, executive, all of them will see the same picture in one system that they’re already using and you don’t have to need additional training for them.
[4:43] So let’s make this concrete, right. Today this is what you will have, and different ways to visualize Open iT data in ServiceNow. The first one is through the SAM Pro dashboards and it’s included with SAM Pro, so if you have SAM Pro it’s there, you don’t need additional configuration or installation to have the dashboard. Of course we’ll need to install the integrator app that will receive the data and trigger transformation but the dashboard itself is already there, and later on I’ll show you how it works or how it looks like. And then the second option is to use the Open iT provided dashboard. So the thing with the first option here is that it gives you the product level insights, right. However we know that it’s good to also look into the feature level insights. If you only have the first one, you can always go back to our reporting tool in Open iT, do the analysis reporting there. But again, if we would like to really share the insights and the reporting to more people, then we would like to also show them the feature level insights in these things. So yeah, we have that. It is tailored specifically for Open iT data.
[6:09] We have the product level and feature level reporting and this is available in Open iT portal, right. And of course the third option is more fully customizable by your team. You can build your own dashboard, you know, design it whatever you want and we help you in creating this dashboard. Talk to one of our team and they will help you. We have a customer already that did this all by themselves, or maybe they had help with Open iT people as well.
[6:39] So yeah, you have options, right. You might want to start with the SAM Pro dashboard first and then extend it with a further configured Open iT dashboard, and of course the more flexible way is to create your own. But I think what I’m saying is that talk to us and we’ll figure out what’s the best way to get the data into ServiceNow. Okay. So, demo.
[7:07] Just a second. I’m going to show you what it looks like in ServiceNow right now.
[7:20] So, the first option as I mentioned, when you install SAM Pro, you will have a workspace. This is this one, software asset workspace. And then of course you will see all the other visualizations there, not only limited to engineering but all the other ones for your SaaS solutions or other applications, business applications. But if you go to, let me just show you this one, software asset analytics, you will see the page there for the engineering license. You have the total spend there, especially if you configured the cost information in ServiceNow. Since it’s there available, it is able to reconcile that data, the usage data we send over to ServiceNow, collect it, reconcile it with other information. So you will have the information about the total spend and also the potential savings. The potential savings here is based on the high level watermark, and then you have the utilization and user ratio. You see the publisher there, the product, the percentage of licenses utilized and also the license to user ratio. Over here you would see the license usage over time. You’ll see how it changes, right? The quantity of licenses you have versus the usage. Of course, all of these data you can click on one of these and then it will drill down into the details, right? But here’s the overview.
[8:58] Denial information is also being sent. So you see, you know, which application, which products has the most denied or most denial events. And then you have the user session summary and also the top denied users.
[9:15] Now, aside from this dashboard, you’ll also be able to see the data in other pages as well, like that one that I’ve showed. We also here in the discovery, you have the list of the engineering license servers. So, you know, the status, for example, if it’s active or not. This is a demo data. So of course, we have that as false.
[9:36] So yeah, these are what you get out of the box with SAM Pro, more on the product level utilization. And if this is all you install, right, then you’ll have to go to Open iT to do more analysis. But as I mentioned a while ago, if you would like more feature level analysis then you can also install this additional dashboard that we provide.
[10:07] So the first one is product. We retain those total spend with potential savings as well. But we added some additional visualization there like license utilization, and we would like to kind of list the different license metric and then compare that. Okay, you might have concurrent licenses but you might have named user license agreement or token or maybe a more consumption per user. So all of those types of licenses or license agreements you have will be listed here.
[10:40] And then also another thing, and this is something that many of our customers would like to see as well, is like, you know, which amongst my products kind of contributes the most with the total cost, right. So here for example I have Power Factory base contributing the most, that is the most expensive product that I have in my portfolio.
[11:04] And then you would like to also look at the unit economics of this application. So in this case what is the average cost per user? And it’s very interesting because it might be that in the overall portfolio it might not be the most expensive, but then if you look into the per producer it might be really expensive in that angle. Right, for example ANSYS here, it’s just the third here in total but per user it actually costs more than the second one on my list here.
[11:46] So then if we start getting more demand from the user community for it, then you can expect that it would really contribute a lot to the total costs. Of course we kept the utilization trend there. You know you would see the max in use versus max available. This will make sense even more if you filter on the publisher and the product, and of course the date is here. It’s very important to show the time period.
[12:16] And then we kept the top users based on elapsed time. And also the active versus inactive usage by publisher.
[12:28] Now this is the product level. Now if you would like to drill down on the feature level, we have additional dashboard for that. You see the top features based on max utilization. So these are the list of the most utilized based on max. But it might also mean that, you know, ANSYS pack for example here, it’s just been maxed out for 5 minutes. We don’t know that.
[12:54] So you have the option to, you know, change the aggregation from max to average. And now you see that actually here, based on average it’s just 78% utilized from this point of time.
[13:10] Right. We bring heat map into the dashboard as well. Really good for analyzing usage pattern. So if you run in your organization a local server and then you expect that the work hour is between 8 to 4, for example, and then you see that on this application, it’s a design application, but then there’s a checkout during off hours, you know, 12 a.m. for example, then something is wrong, maybe in there, so you might want to investigate that. It’s also very, it gives you an insight as well if you are running a global setup and you would like to kind of simulate or look at how it looks like, you know, because in Open iT we have a way to simulate a global license agreement without changing it.
[14:08] So if we bring that data here as well you can see how it maps out in the heat map.
[14:14] Of course, top users based on elapsed time and then top denied users as well. Now all of these data, you can drill down into details, right. So for example this one, if you’d like to see the details there, just click on one of the visuals there and you’ll see max in use. We’ve seen that it’s max utilized but here, you know, max utilization sometimes drops to 40, 20, on different dates.
[14:47] So aside from this, I was mentioning a while ago about bringing in the data that you needed, just to demonstrate how it looks like. So this is an example. It’s a license monitor. So it’s showing near to real-time data, right? So you’ll see there all the vendor licenses that you have, the publisher of course, features, the server name, the daemon, you know, and also their status, license, expiration, etc. is available in this view as well. So yeah, those are just some of the options to visualize the data right now.
[15:27] But I would like to go back to my slide to talk about something that I think is really important for this, and that is about the normalization.
[15:43] Okay, I think it’s a crucial concept in engineering application, the normalization, and I think many of you here have experience, you know, with apps like ANSYS.
[16:05] So let’s just take this one, electronics desktop, as an example, right. So that one can belong to Prepost here, HFSS, SIwave, you know, and then just imagine that you have licenses for all of these three products, right, and you use electronics desktop, you know, then the question is what product did you actually use? Is it this one or this one or this one, right? So because the feature can be mapped to more than one application we cannot simply rename the feature to a new name. That is why in Open iT we have this longstanding solution, we call it feature set mapping. It handles the many to many relationship cleanly and accurately. Right now, to ensure the usage is calculated correctly, the normalization must happen early during the data processing, not later. And that’s something of course that we had in mind when we created the integration, right. It resolves feature to product mapping up front so the downstream usage reports are clean, consistent, and reliable.
[17:27] Now to illustrate further the importance of feature set mapping, I want to cite this real use case. So we have this customer and they’re running ANSYS, right, for HFSS. And ANSYS, actually the vendor, they were calculating the usage based on averages, and based on the average calculation they need 17 more. But as I mentioned in the previous slide, you know, you cannot just do the averages because it might belong to different products. So there are things that you have to consider, something that feature set mapping solves. So when we did that, we applied our feature set mapping, our own algorithm, and calculated the concurrency run license efficiency. We saw that actually they just need seven to cover 99% of the time based on the usage, and that gives them this amount of cost avoidance. So I would really like to just highlight, you know, how important it is to do the proper concurrency calculation, do the proper mapping, and also when to do it.
[18:57] So yeah, I made a case here on why we should do the normalization early on and that Open iT handles it very well. I want to show you very quickly how the data flows. Okay.
[19:14] So here, the normalization happens here. I think some of you might be aware already, you know, we collect data from different sources. We process the data, we do the normalization and then we send the data over to our integration app, and once received, it triggers transformation, reconciliation with other data sources. From there the data will be available in the dashboard and also it will be integrated with the different actions already available in ServiceNow. So this is the flow of the data.
[19:53] Now there is another thing that I would like to mention as well. Another key point I want to emphasize is about the shared software asset directory. So what is it and why is it needed? So I’ve been talking about normalization and to perform it properly we need some form of central catalog, you know, that defines what the products are, what’s in there, you know, what features are included in the product, what executables, what’s the vendor, this kind of information. So in other words, some kind of product registry. And in the engineering world, we’ve looked for such a catalog for a long time, but we really haven’t found one that covers our need focused on the engineering. There’s a lot of catalogs available for business applications but for the engineering it’s hard to find one. So we decided to build our own and that is the shared software asset directory here.
[20:50] It stores critical information like, you know, the product name that you can find in the price book. That includes also the publisher name. It also includes other information like the discipline, the workflow. It gives you the executable information. We also put there some knowledge that we have acquired, you know, for example, how do I identify if the application is active or not, what kind of metrics do we need to look at in order to identify that level of activity. And then you also have some classification information like UNSPSC. Right. So yeah, and then this directory of course is being expanded continually. We built a team that maintains this and, you know, to discover more.
[21:56] So yeah, okay, so to recap, things that I would like to point out. Number one, SAM Pro, very good with business apps, Open iT very good with engineering applications. This is our expertise. We need to integrate them to see wider visibility for all stakeholders, and we have three ways to do that right now. Just to recap, we have this SAM Pro dashboard already available. We have a dashboard that we can provide, it’s available in our customer portal, and then of course you can build your own. We can provide assistance with that. Okay. And actually I think I was very good with the time and we are open for questions.
[22:52] Nix: Thank you, Malou, for that clear and insightful deep dive. We’ve got some great questions that came in. So, let’s jump into the Q&A.
[23:00] First, we have this question. Were those reports such as the heat map default ServiceNow reports or an Open iT add-on implemented in ServiceNow?
[23:12] Malou: Yes. It is add-on. Okay, let me share again. So the default that comes in SAM Pro is more on product level information.
[23:32] So this is what comes out of the box, right? It’s more on product level. The idea really is to, you know, reconcile it with the cost information. And the heat map is a feature level that we provide in addition. Okay, actually we’re trying to have this published right now. But it’s already available out of the using customer portal that we have. But hopefully soon we are able to publish this in the app as well, in the store. Oh, I forgot to mention that the store app is here.
[24:10] So if you just, you know, search for Open iT or LicenseAnalyzer™ you’ll see the integration app. Thank you. I hope that answered the question. The answer was no. It’s additional. The heat map is additional.
[24:23] Nix: Great. Thanks Malou. Moving on to the next question. Are there additional licensing or cost requirements to use the Open iT integrator app?
[24:33] Malou: Yep. Great question. From the Open iT side, there’s no extra charges. So you see here it’s free and the pricing is free. On ServiceNow side, I think if you have SAM Pro, you are generally good to go. But I think it’s still best to double check with your ServiceNow account manager if there’s additional licensing that is needed.
[25:02] Nix: Great. We also have here another question. So they’re saying thank you for the nice presentation. Their question is how to establish the ratio like 1:7, 1:5. What is a healthy ratio for license usage?
[25:27] Malou: Oh, license usage per user. So it depends, right? So if you have, for example, if you’re sharing concurrent licenses, I think it depends. I think what we’ve seen is like one to four licenses to one, but it also, that’s why the cost is important, right, as well. And then this is something that we also do. And hopefully you got some help with our expert to do that, because we have this reporting that based on cost we can say, what do you call this, we can say that it makes sense for you to, say for example, it’s cheaper for you to have concurrent licenses because you have four users sharing that instead of just one named user. So I think it depends but it’s really good if you can have the cost and then simulate that based on the usage, because we have reports that show you how many licenses you have if you have named user, how many licenses you will have if you have distinct or host named host, how many licenses you would need if you have concurrent users. Right, so if you can get all these kinds of reports and then compare the cost, you know, you would be able to know what is the best ratio there based on the cost.
[27:00] Nix: Thank you Malou. And lastly, how frequently is data synchronized and can we adjust that frequency?
[27:10] Malou: Yeah. Okay. So once it is set up the data flows automatically once a day, that’s daily. And yes you can change the frequency, but once is in most cases is enough.
[27:29] Nix: Thank you Malou. And I believe that wraps up our Q&A session. Thank you again Malou for the very informative answers.
[27:39] Before we close, a quick reminder. This session was recorded and you’ll receive the replay via email soon. You can also find it on our webinars on demand page at openit.com.
[27:51] Alongside the webinar recordings is a link to our survey. Send us your feedback and any topic you’d like for us to cover. We also have another webinar upcoming with Optimal, one of our partners, unlocking hidden value with software asset management. Just scan the QR code on your screen or visit resources webinars on our website. If you’d like to explore how Open iT and ServiceNow SAM Pro can help streamline license management in your organization, we’re offering a free 30-minute consultation with one of our business solutions consultants.
[28:24] If you’re already an Open iT customer, reach out to your account manager for personalized support or next steps.
[28:32] Thanks again for joining us today. I’m Nix and we’ll see you at the next webinar.
[28:39] Malou: Thank you.