


- LicenseAnalyzer data can be used with Power BI and Tableau to create customizable software usage reports.
- Custom dashboards help teams tailor views for different stakeholders, use cases, and decision needs.
- BI-enabled reporting makes software license insights easier to analyze, share, and act on.
Custom reporting is where executives and analysts actually engage with license data, and the format matters as much as the underlying numbers. LicenseAnalyzer's integration with Power BI and Tableau lets organizations build customizable reports that fit their own decision frameworks rather than the report templates the licensing tool happens to ship with. Open iT positions the integration as the layer that lets the SAM team meet stakeholders in the BI environment they already work in — turning license reporting from a separate channel into part of the regular analytical flow.
Open iTのLicenseAnalyzerの主な機能の 1 つは、特定のニーズや好みに合わせて カスタマイズ可能なレポート テンプレートやアドホック レポートを作成できることである。LicenseAnalyzer内蔵のレポート デザイナを使用してレポート テンプレートを作成および編集することも、Open iT Analysis Server のデータを、より高度なデータ分析および視覚化機能を提供する 2 つの一般的なビジネス インテリジェンス ツールであるPower BI またはTableau に接続することもできます。
この資料では、LicenseAnalyzerと Power BI/Tableau を使用して、カスタマイズ可能なレポート テンプレートとアドホック レポートを作成する方法を説明します。
パワーBI
Open iT Analysis サーバーのデータを使用して Power BI でカスタム レポートを作成するには、以下の手順に従います:
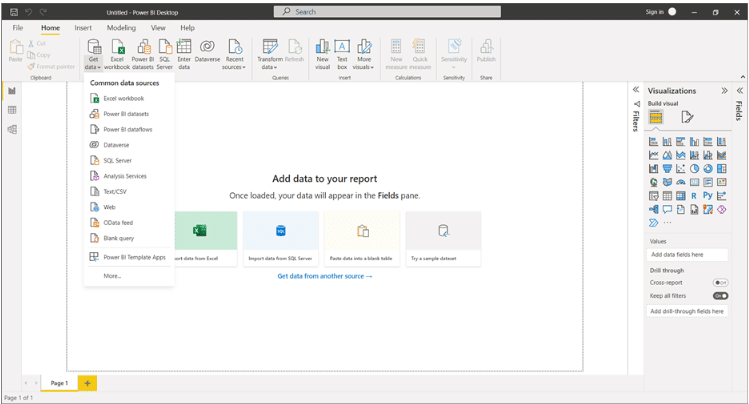
- まず、"Home "タブで "Get Data" > "From Database "を選択し、"Analysis Services"を選択する。
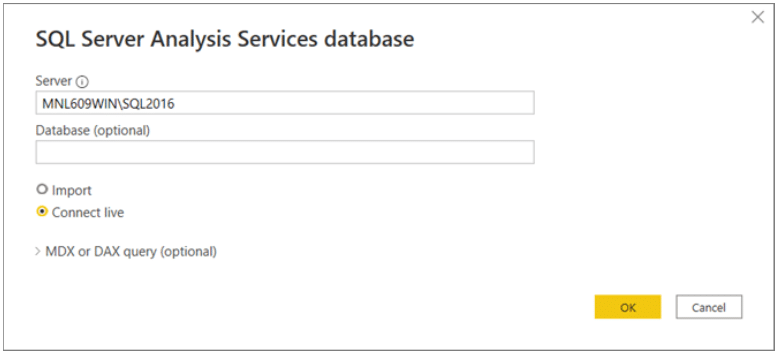
- SQL Server Analysis Servicesデータベース・モーダルで、サーバーを指定し、"OK"をクリックする。
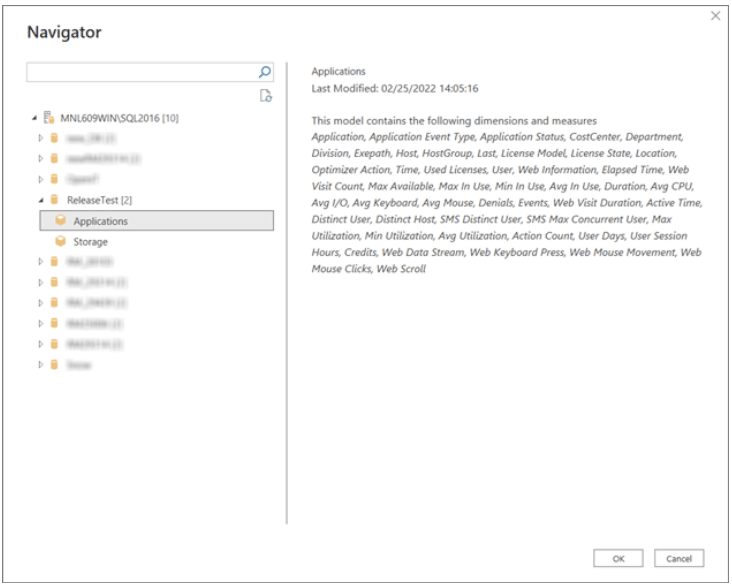
- 次に、必要なデータベースとキューブを選択してから、再度 "OK" をクリックします。
- 新しい可視化を開始し、基本的なレポートを作成するには、キャンバス上にフィールドをドラッグします。

テーブルやビューからレポート・キャンバスにフィールドをドラッグ・アンド・ドロップし、フィルター、スライサー、フォーマット・オプションを適用し、チャート、マップ、テーブル、マトリックスなどの様々なビジュアライゼーションから選択することができます。
また、DAX言語を使用して計算列やメジャーを作成し、データに対して高度な計算や集計を実行することもできます。
レポートを保存するには、[ファイル] > [名前を付けて保存]をクリックし、名前を付けます。レポートをPDFまたはPowerPointファイルとしてエクスポートすることもできます。

タブロー
指示に従って、Tableau をOpen iT Analysis Server に接続し、カスタム・レポートを作成します:
- Tableau Desktop を開き、データソースとしてOpen iT Connectorを選択します。
- Open iT Analysis Server がインストールされているサーバー名とデータベース名を入力します。接続]をクリックします。
- データベースからアプリケーションファイルを選択し、データペインにドラッグします。今すぐ更新]をクリックします。
- データがロードされるのを待ち、ワークシートとダッシュボードの作成を開始する。
- ワークブックを保存し、Tableau Server または Tableau Online に公開します。
- Tableau Server または Tableau Online にサインインして、ワークブックを表示し、組織内の他の人と共有します。
Tableauの機能と関数を使用して、データ分析と可視化をカスタマイズできます。さまざまな種類のチャート、フィルター、計算、パラメーターを使用して、さまざまな方法でデータを探索できます。
ワークブックをあなたのブランディングやスタイルの好みに合わせてフォーマットすることもできます。ビジュアライゼーションの色、フォント、ボーダー、背景、その他の要素を変更できます。
Open iT は、Power BIを使用して生の利用データを実用的な洞察に変換する方法についてのライブウェビナーを開催しています。今すぐウェビナーにお申し込みください!