


- LicenseAnalyzer data can be used with Power BI and Tableau to create customizable software usage reports.
- Custom dashboards help teams tailor views for different stakeholders, use cases, and decision needs.
- BI-enabled reporting makes software license insights easier to analyze, share, and act on.
Custom reporting is where executives and analysts actually engage with license data, and the format matters as much as the underlying numbers. LicenseAnalyzer's integration with Power BI and Tableau lets organizations build customizable reports that fit their own decision frameworks rather than the report templates the licensing tool happens to ship with. Open iT positions the integration as the layer that lets the SAM team meet stakeholders in the BI environment they already work in — turning license reporting from a separate channel into part of the regular analytical flow.
One of the key features of Open iT’s LicenseAnalyzer is the ability to create customizable report templates and ad-hoc reports that suit your specific needs and preferences. You can use the LicenseAnalyzer built-in report designer to create and edit report templates, or you can connect the Open iT Analysis Server data to Power BI or Tableau, two popular business intelligence tools that offer more advanced data analysis and visualization capabilities.
In this document, we will show you how to create customizable report templates and ad-hoc reports using LicenseAnalyzer and Power BI/Tableau.
Power BI
Follow the steps below to create custom reports in Power BI using data from the Open iT Analysis server:
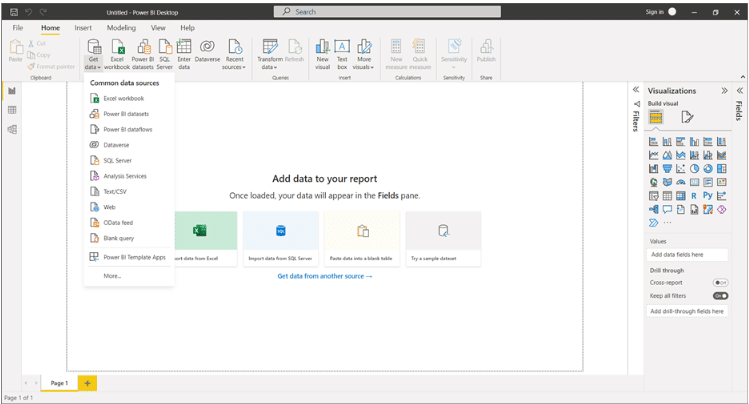
- To begin, navigate to the Home tab and select “Get Data” > “From Database,” then opt for “Analysis Services.”
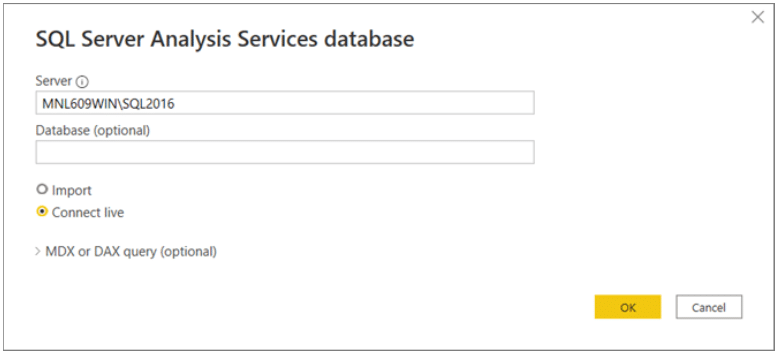
- In the SQL Server Analysis Services database modal, indicate the Server and proceed by clicking “OK.”
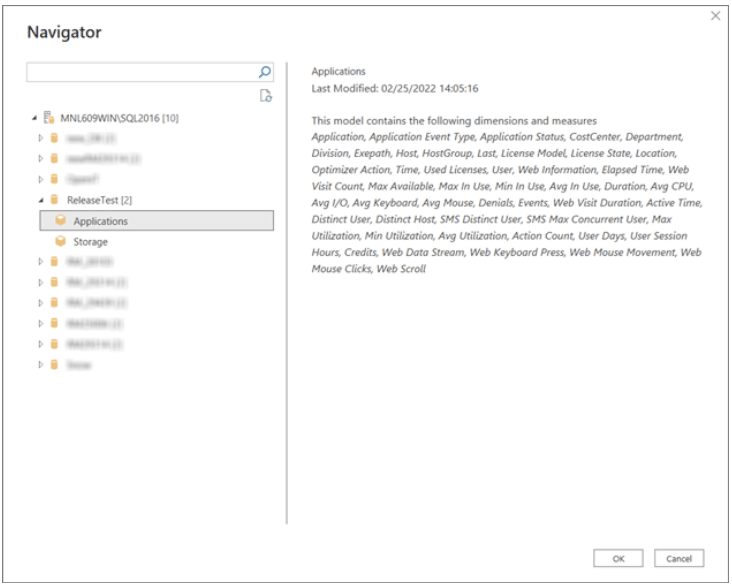
- Next, select the desired database and cube before clicking “OK” again.
- To initiate a new visualization and create a basic report, drag a field onto the canvas.

You can drag and drop the fields from the tables and views to the report canvas, apply filters, slicers, and formatting options, and choose from various visualizations such as charts, maps, tables, and matrices.
You can also create calculated columns and measures using the DAX language to perform advanced calculations and aggregations on the data.
To save your report, click File > Save As and give it a name. You can also export your report as a PDF or PowerPoint file.

Tableau
Follow the instructions to connect Tableau to the Open iT Analysis Server and generate custom reports:
- Open Tableau Desktop and select Open iT Connector as the data source.
- Enter the server name and database name where the Open iT Analysis Server is installed. Click Connect.
- Select the Application file from the database and drag it to the data pane. Click Update Now.
- Wait for the data to load and then start creating your worksheets and dashboards.
- Save your workbook and publish it to Tableau Server or Tableau Online.
- Sign in to Tableau Server or Tableau Online and view and share your workbook with others in your organization.
You can use Tableau’s features and functions to customize your data analysis and visualization. You can use different types of charts, filters, calculations, and parameters to explore your data in different ways.
You can also format your workbook to match your branding and style preferences. You can change the colors, fonts, borders, backgrounds, and other elements of your visualization.
Open iT is holding a live webinar on how to transform the raw usage data into actionable insights using Power BI. Sign up for the webinar now!