Business intelligence based on analysis of aggregated data is one of the most important topics in the business world today. More and more businesses are discovering the importance of collecting, storing and analyzing the diverse data available within the business processes to gain competitive advantage. With the number of business intelligence technologies available for enabling effective data analysis, it is essential to pick the right tool, one that can deliver fast and accurate results. This article will focus on one tool that is proven to give these results: OLAP.
Online Analytical Processing (OLAP) is a database structure optimized for rapid display of multi-dimensional data. OLAP databases are often referred to as “cubes”, an effective way to think of multidimensional data. In a simplified sense an OLAP cube is something like a three dimensional spreadsheet, though OLAP is able to handle more than three dimensions. OLAP databases are typically implemented in specially designed relational databases, optimized to deliver rapid results to queries. OLAP databases can substantially outperform flat file databases and typical or transactional relational databases when it comes to providing fast answers to multi-dimensional queries.
But how does OLAP actually do this? Let’s compare a standard relational database and OLAP. To demonstrate this, a possible question that IT managers responsible for managing and optimizing software assets may want answered is:
What is the maximum license usage for a particular product within a particular year?
Now, imagine the IT manager has a very large database of historical usage records. To answer that question using a conventional relational database, you need to get the information from different tables. You combine all the data and perform a query to extract the information that you need.
For complex queries, this can be a slow process. What happens when the IT manager wants to drill down on that information? For example, he or she now would like to know:
What is the maximum license usage for a particular feature in the product within a specific month at a particular site?
The IT manager would then need to re-perform the query. Applying these filters will further slowdown an already slow process, which is not an option for a business that needs information fast.
Where fast data retrieval is a priority in planning, problem solving and decision support, businesses can take advantage of multi-dimensional tools such as OLAP. In OLAP, stored data is pre-aggregated, which can bring results instantaneously even with large amounts of data. Cubes can have many dimensions which can be used to aggregate, slice and dice the data. In addition, one can further slice the dimensions into hierarchies built directly within the cube.

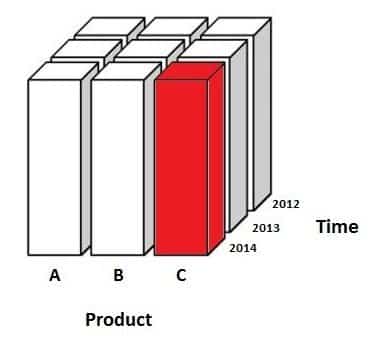
The figure above illustrates the OLAP approach to answering our first question. Two of the dimensions for our cube are Product and Time. Through the pre-aggregation of these dimensions, we can instantly retrieve the information we need. The highlighted area is the Maximum License Usage of Product C for the year 2014.
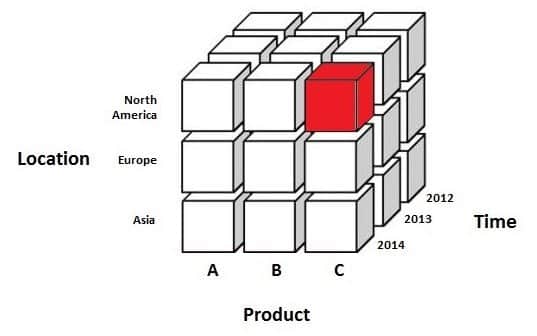
Another dimension that we may add to our OLAP cube is Location.

This shows how OLAP performs multi-dimensional analysis. In this example, the OLAP cube pre-aggregates the Location dimension with Product and Time. The highlighted area shows the Maximum License Usage of Product C for the year 2014, but this time only for North America.
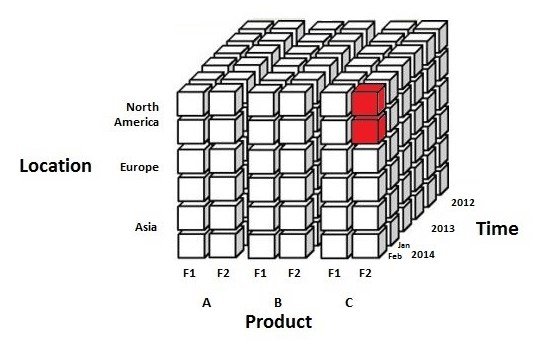
And from that data, we can instantly drill down on our information using hierarchies. This figure shows the Maximum License Usage of Feature 2 – Product C for February 2014 in North America.

In designing a cube, one focuses on providing answers to a small sets of questions addressing fundamental business needs. A cube built on well-considered pre-allocation of data answers these questions, easy and fast. This is what OLAP does. It allows one to explore business data efficiently – a clearly smart reason to consider business intelligence tools that utilize OLAP, such as the Open iT Analysis Server.
The Analysis Server is an advanced software asset management tool addressing the needs of individuals tasked with managing complex and expensive software asset portfolios. Along with Open iT modules, the Analysis Server can provide rich reports on the many facets of <software asset management (SAM), such as license usage, application, server and storage usage, in a fast and efficient way.


