

Engineering & Manufacturing
Engineering software license management: how many licenses do your engineers actually need?
Engineering software license management is the practice of measuring what engineers actually do with the licenses you own, then sizing contracts, reclaiming idle seats and recovering cost on that evidence. In an engineering or manufacturing business it moves three numbers: the renewal quantity, the denial rate at peak, and the share of software cost that lands on the job that caused it.
See what your estate actually costs. A usage assessment meters one renewal cycle across your Autodesk, Bentley, Dassault, Siemens or ANSYS estate and shows real demand against the seats you pay for.
The Outcome
Burns & McDonnell, an 11,000-person engineering firm, put Open iT across 400+ design applications and 150 license servers. Management recovered as much as 25% of total engineering software spend on underused licenses. Matching entitlements to real use took out $700,000 a year. When a downturn stalled projects, they cut $350,000 a month in leased licenses. Their director’s line: “Data talks louder than opinions.”
01
What are you actually paying for?
Your purchase records say what you bought. Your license servers say what got opened. In most estates those two lists have never been compared, and the gap is the whole opportunity.
The reason is fragmentation, not negligence. One engineering consultancy tracks roughly 1,200 paid titles inside an installed base of about 3,500, licensed hundreds of different ways: named user, concurrent, node-locked, hardware-locked, perpetual. Another counts 1,600 tools from 400 vendors. Nobody built that on purpose. It arrived one project, one acquisition and one specialist request at a time.
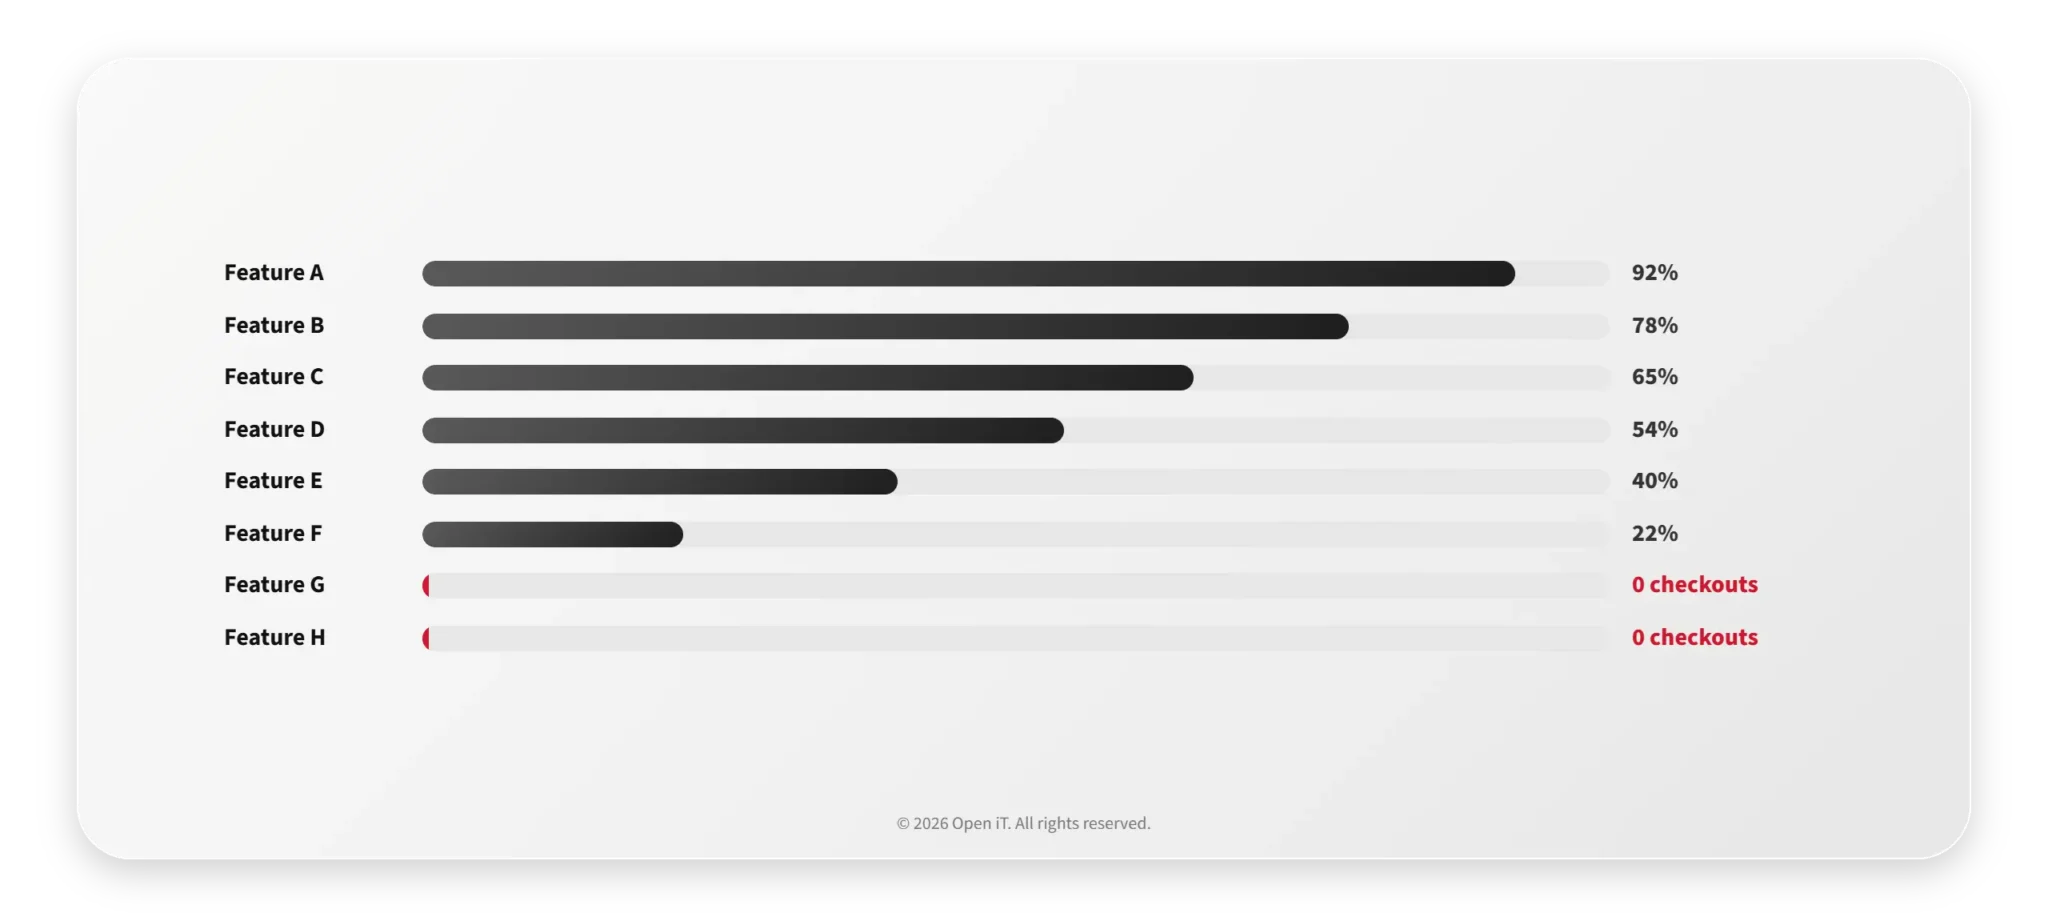
Ranked feature usage across a license server sorts it in an afternoon. The titles with zero checkouts over a full year are the first line of the renewal conversation. So is version sprawl: it is normal to find five versions of the same application in concurrent use, with the heaviest activity years behind the current release even where current-version seats are abundant. That is a training cost and an IT patching burden as much as a license cost, and it is invisible until someone reports usage by version.
02
Checked out, or actually being used?
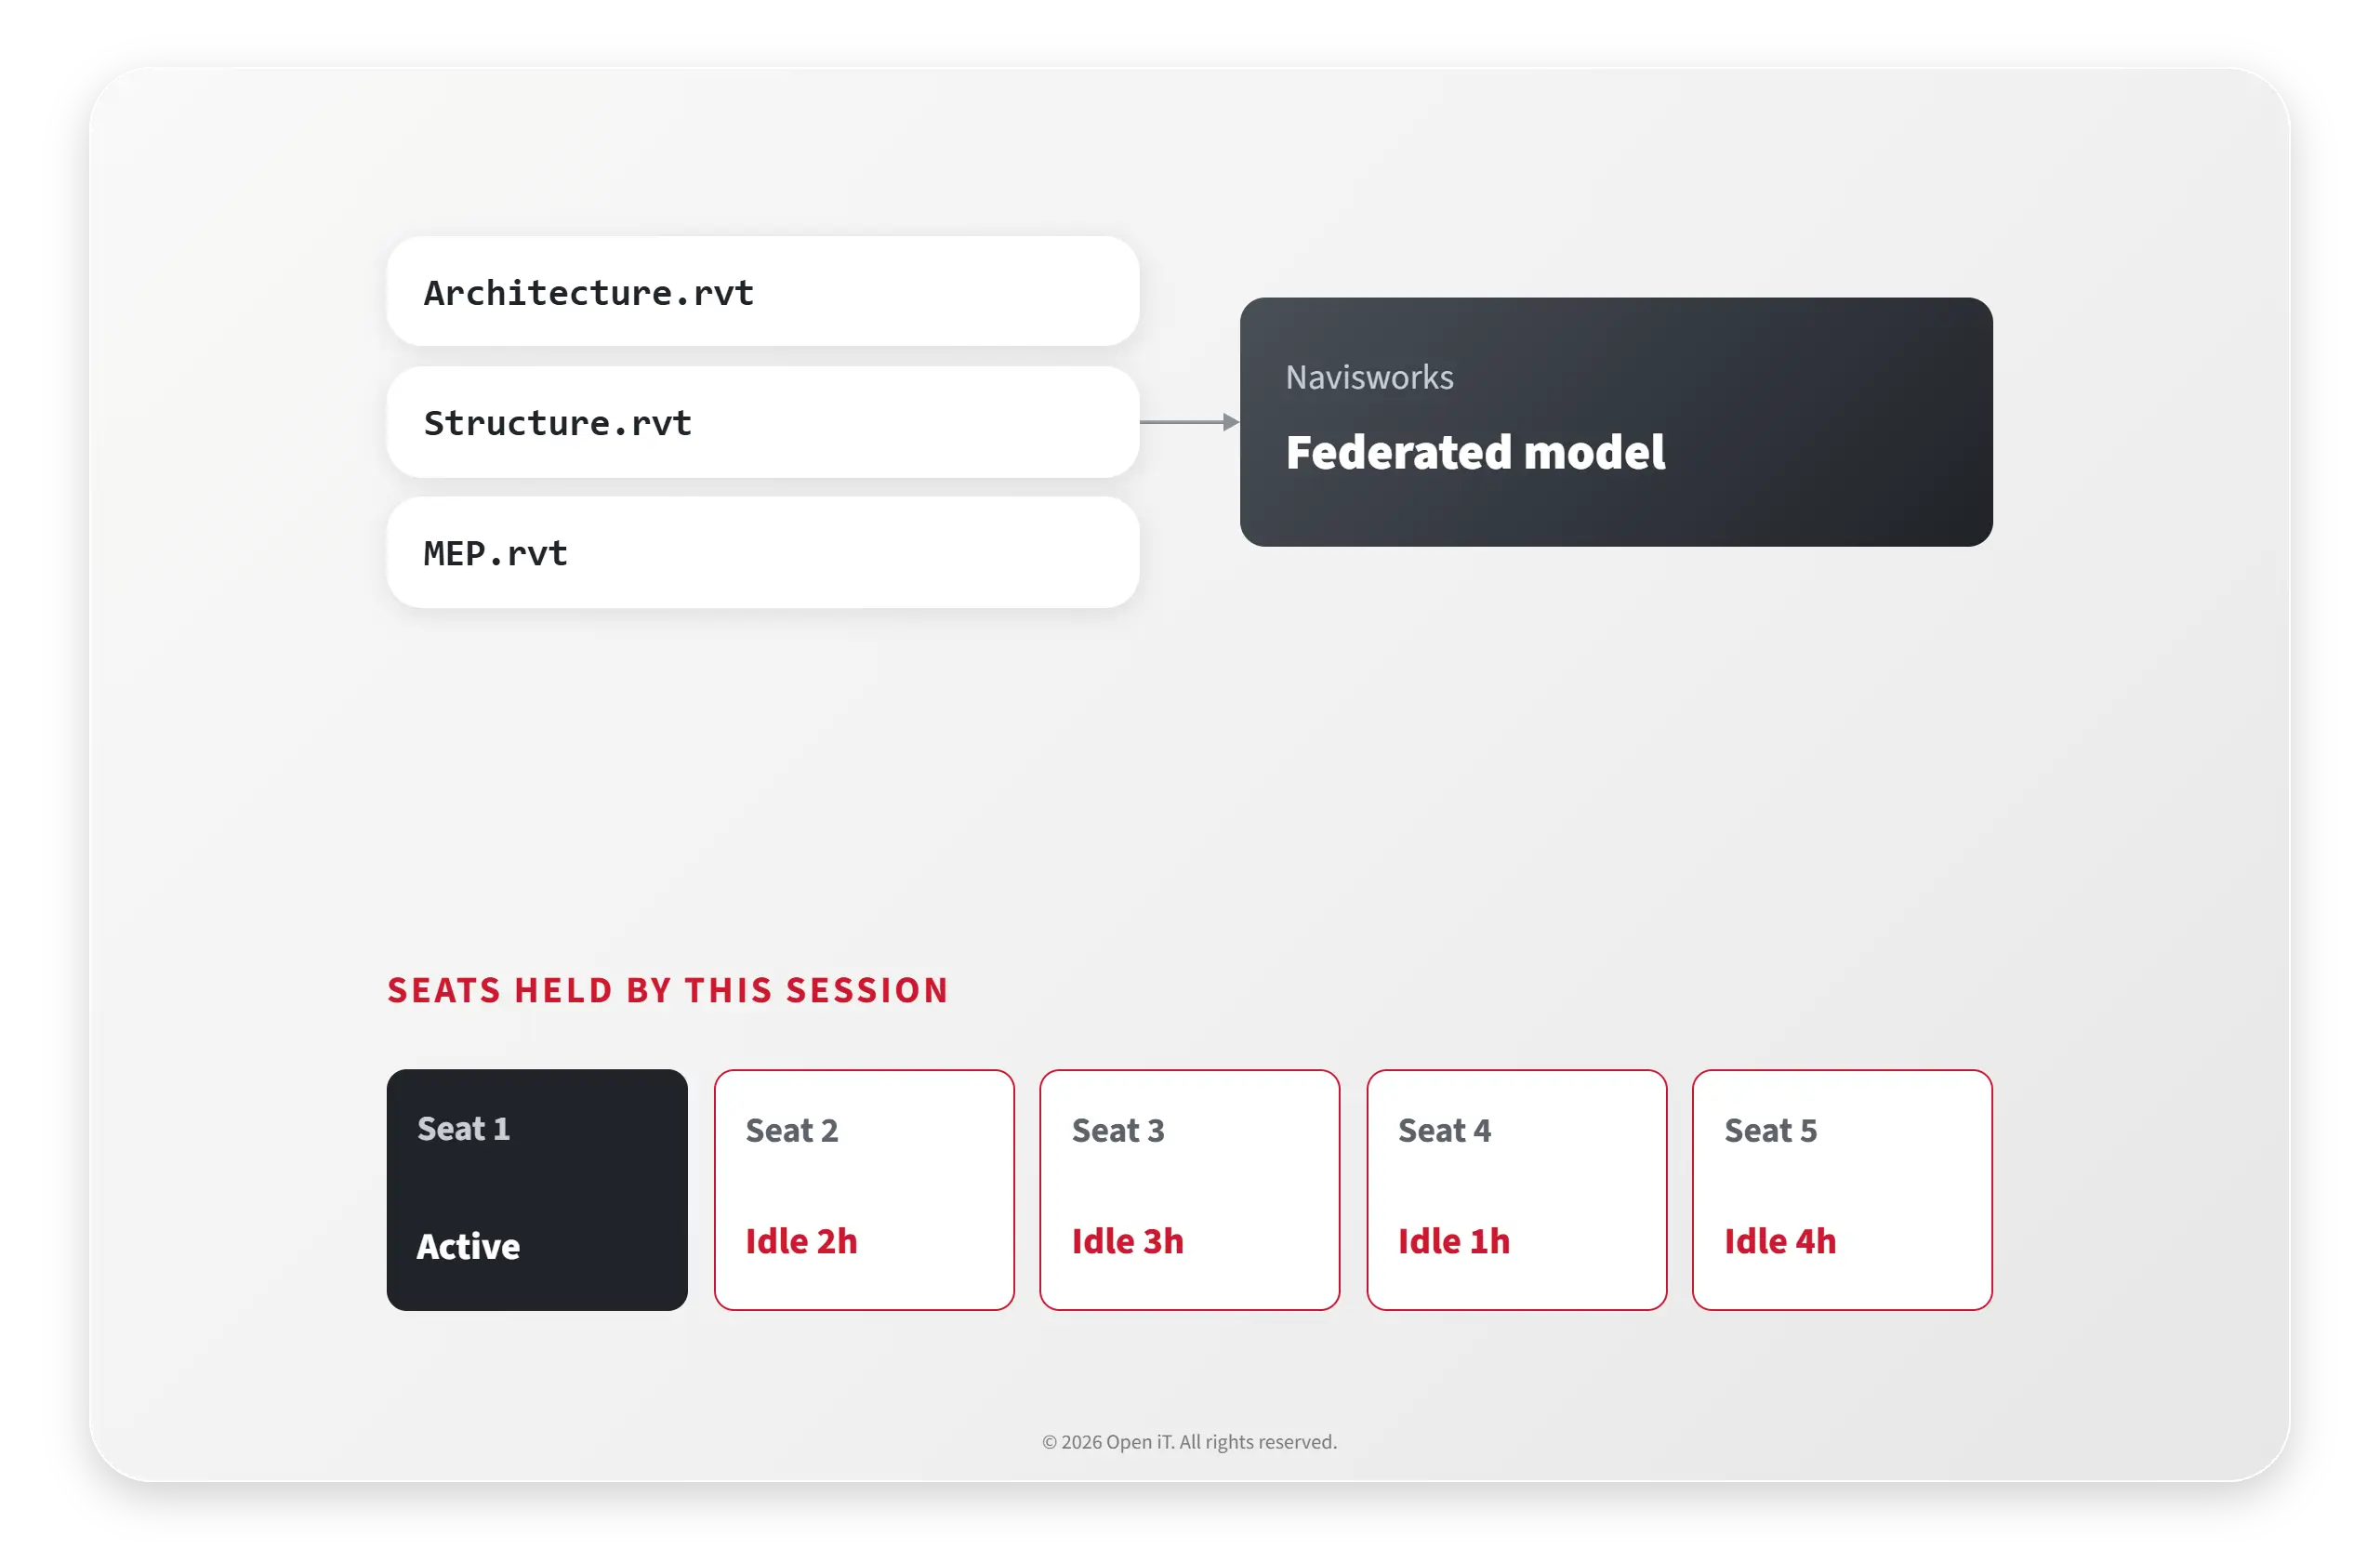
A license checked out is not a license used. Your license server records that a seat was reserved. It has no way of knowing whether anyone was working in it, and last-day-used is not enough to make a purchase decision with.
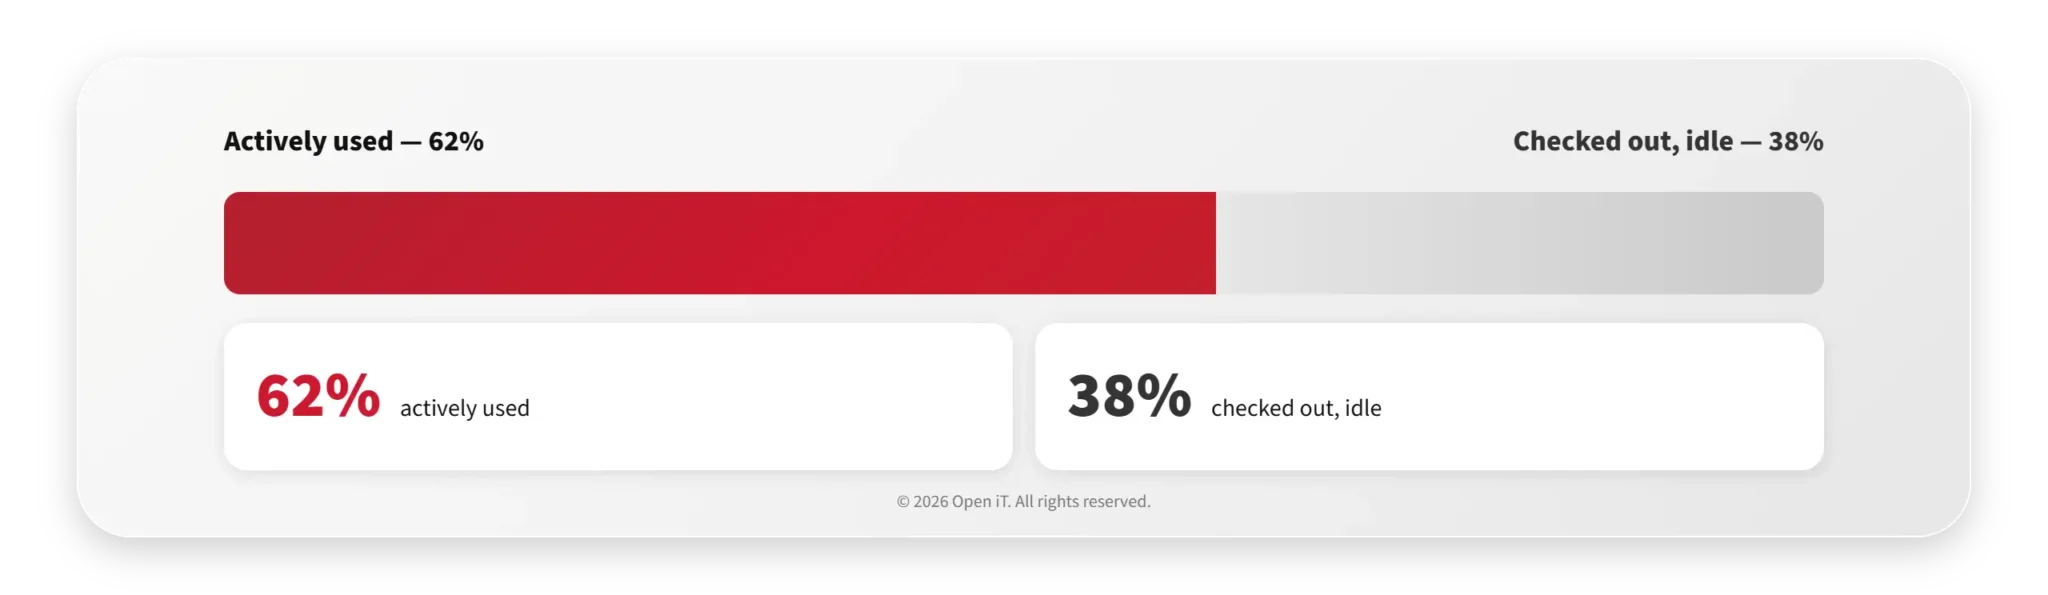
Level 1 Runtime Usage captures the checkout record off the license manager. Level 2 True Active Usage correlates keyboard, mouse, CPU and I/O activity on the host machine against that checkout, and the Work Ratio Report is the metric built to quantify the difference – active time as a ratio of total checkout time. Independent metering typically puts idle seats at 20–40% of an engineering estate at any given moment.
Level 3 Managed Usage acts on the measurement, with four methods: log, standby, suspend, terminate, supported on FlexLM, LM-X, LUM and RLM. Suspend is usually the right default rather than terminate, because reopening a heavy application is not free – in measured cases on Petrel and ANSYS Workbench, five to fifteen minutes. The engineer keeps the session; the pool gets the seat back.
03
How many licenses do you actually need?
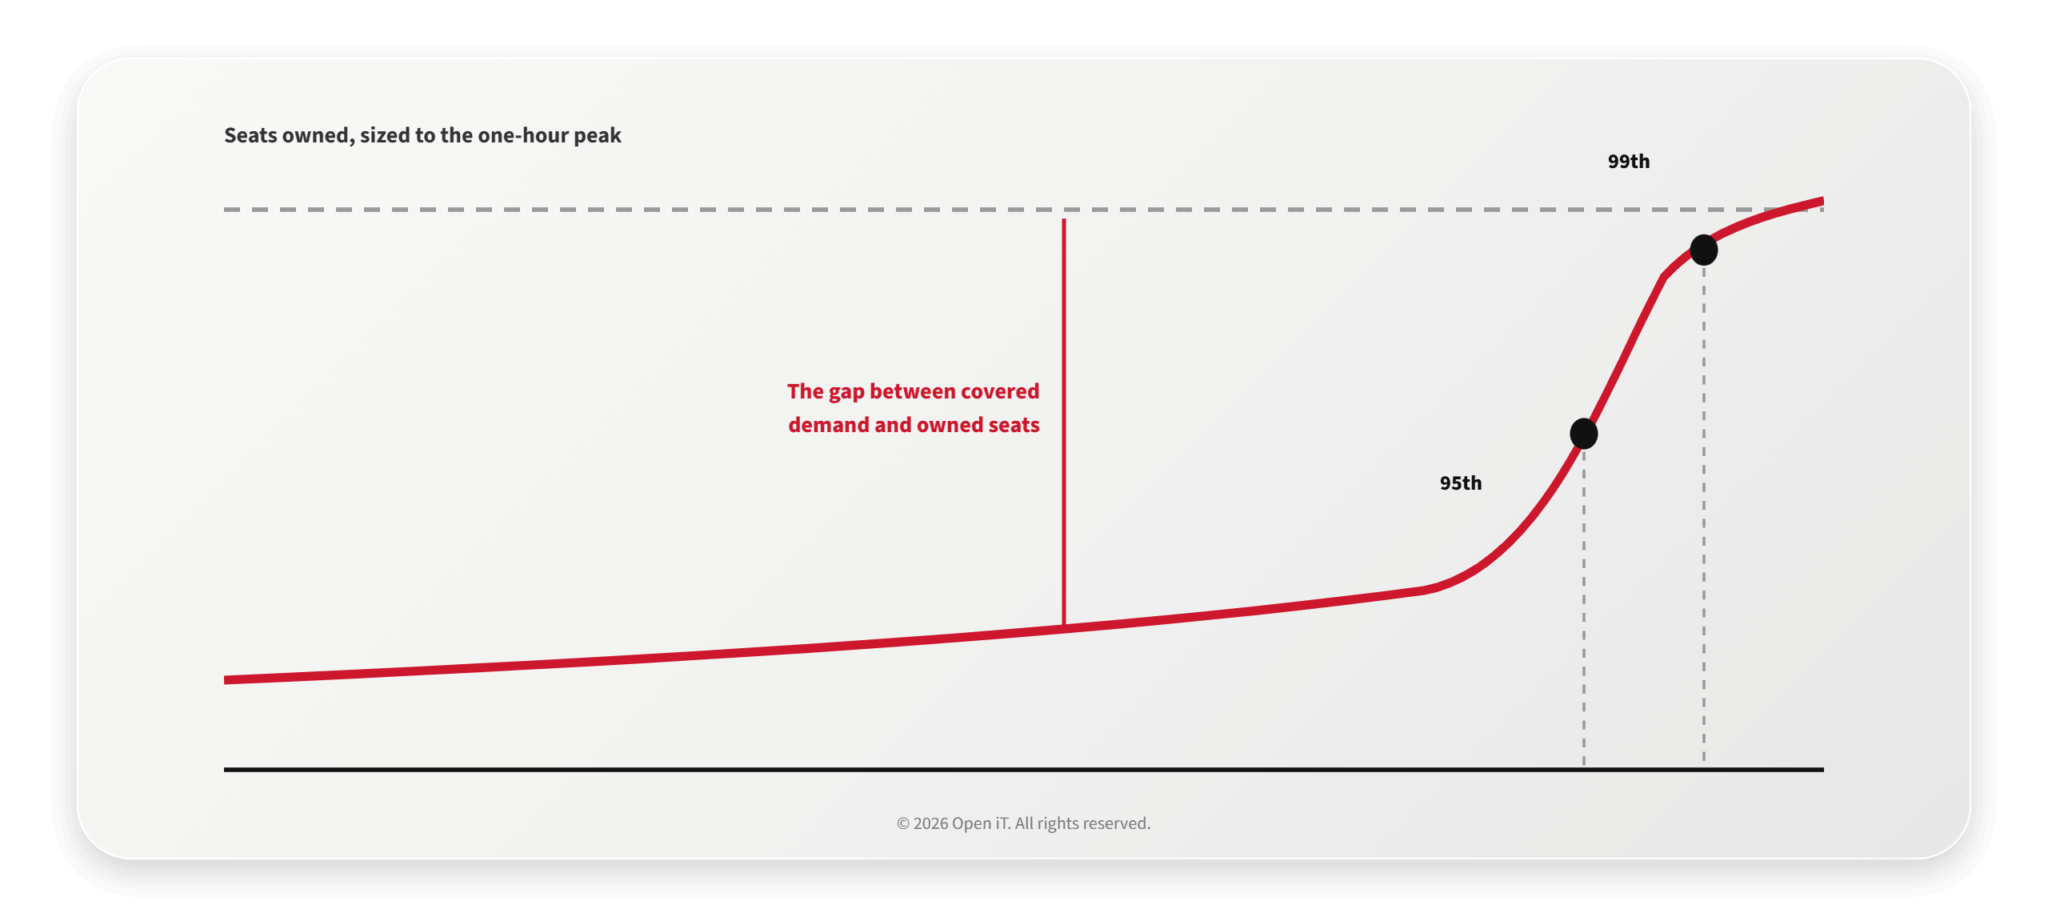
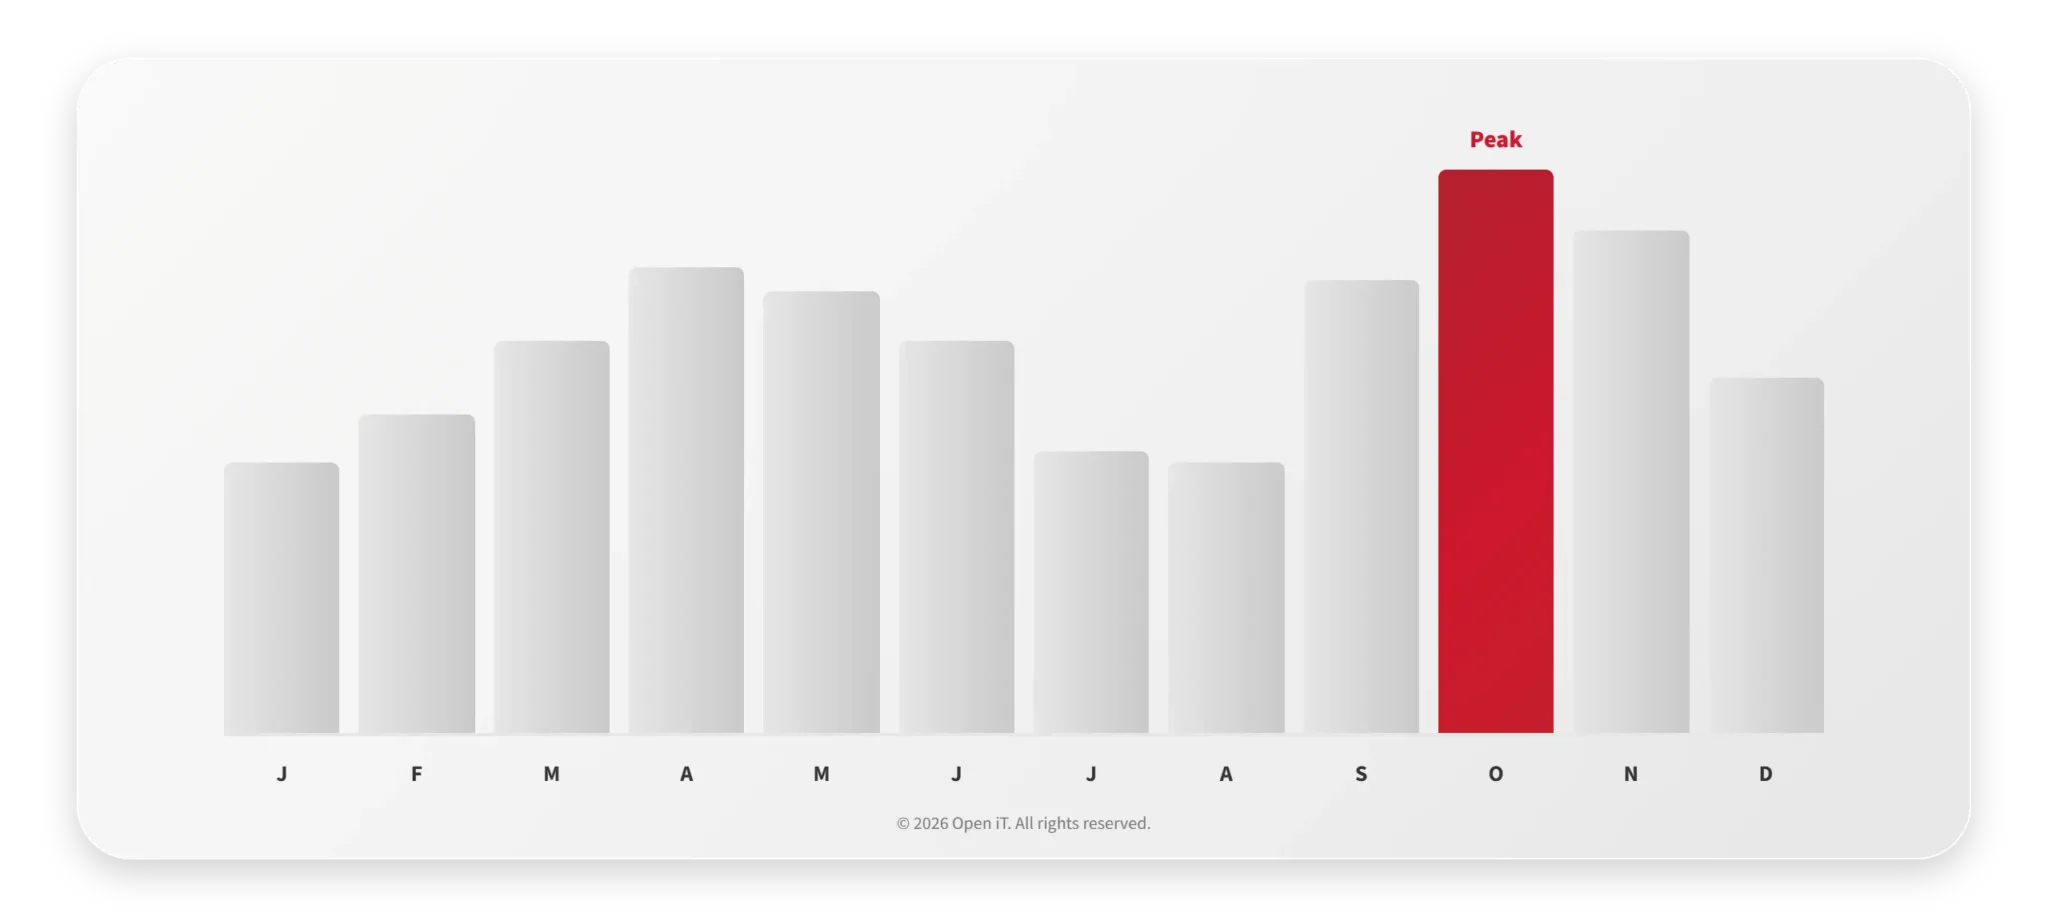
Not the peak. The peak is one hour of one day, and it is the number that has justified every over-purchase in your history. The License Efficiency Report gives the count that covered 95% and 99% of demand instead, which is the quantity worth taking into a renewal.
The mirror image matters just as much. A feature that sits at capacity with heavy denials looks like a shortage, and sometimes is. But denial reason reporting separates two very different problems: denied because the pool was genuinely exhausted, or denied because a colleague was holding four seats and went home. User-level heatmaps of concurrent seats and elapsed time put a name against the second case. One is a purchase. The other is a conversation, an options file or a Level 3 threshold.
Mitta Oy needed 30 seats of 3D Win, not the 130 it had assumed, and cut its Autodesk licenses by half with no loss of productivity. The savings released on the over-bought features are what fund the under-bought ones, inside the same budget.
| What the report answers | The report | What you can ask for |
|---|---|---|
| How many seats did demand really need? | License Efficiency Report – count at the 95th and 99th percentile | A renewal quantity set by covered demand, not by a one-day peak |
| Is this a shortage or a distribution problem? | Denial Report, broken down by denial reason | Either more seats, with evidence, or a reallocation that costs nothing |
| Who is holding seats they are not working in? | User heatmap – concurrent seats and elapsed time per user | A named-user agreement for genuine power users; reclamation for the rest |
| When will demand outgrow what we own? | Twelve-month utilization trend and hourly heatmap | A purchase timed to the project pipeline rather than to a denial complaint |
04
Who should the cost land on?
Most firms distribute software cost by headcount, because that is the only key available when nobody can attribute usage. It is also the reason the office that barely opens an application subsidizes the one that lives in it, and the reason a project’s real software cost never reaches its margin.
Attribution needs three things. Organizational structure, imported from Active Directory so every checkout carries a department, location, cost center or project. Bundle translation, because a collection license has to be mapped from raw features back to the product name in the vendor’s price book before it can be charged to anything. And a decision about how far to go: showback while the data accumulates, chargeback once the numbers survive scrutiny.
Projektengagemang bills 38 subsidiaries on this basis, and light users no longer subsidize heavy ones. Where the requirement runs deeper it can run much deeper: one 6,500-user specification called for project attribution synchronized from Oracle, hourly and monthly billing models, and client billing based on actual usage.
One practical obstacle worth naming, because it stops this work in shipbuilding and plant environments in particular: where a whole team signs in under one shared administrator account, checkout logs cannot tell anyone apart. Hostname capture plus a rename mapping resolves that back to named users, as long as the host-to-user relationship really is one to one. Where two people share a workstation, it does not, and no tool can invent the difference.
05
Can you take the number to your vendor?
Only if your vendor cannot dismiss where it came from. Plenty of firms have no independent way to check the utilization figure they are shown at renewal – one prospect put it flatly: no ability to verify the vendor’s reports.
Open iT reads your own license servers, so the record is your log rather than an interpretation of it. Level 1 polls hourly at five-minute sample intervals and runs continuously, which means the twelve-month history exists before the renewal rather than being assembled the week of it. That is what makes the percentile number arguable instead of assertable.
Burns & McDonnell moved onto Hexagon’s new licensing model on its own terms, using its own denial and usage data. Aibel pushed utilization past 99% efficiency, absorbing demand across European and Asian shifts rather than buying for both peaks.
06
Will it cover our estate?
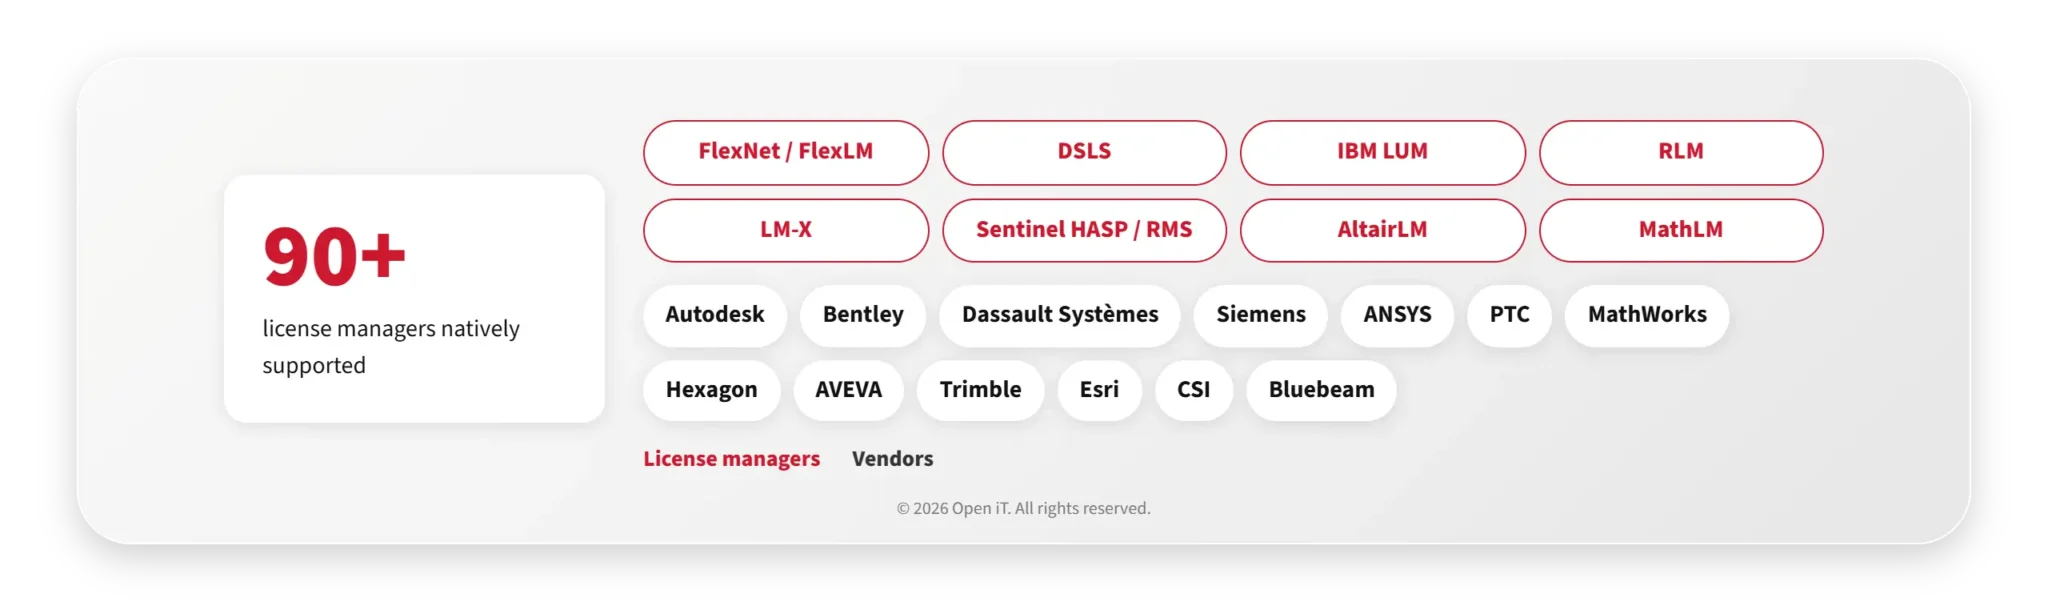
A fair first question, and usually the real one. 90+ license managers are supported, FlexNet and FlexLM, DSLS, IBM LUM, RLM, LM-X, Sentinel HASP and RMS, AltairLM, MathLM, Autodesk Cloud among them.
On the applications: Autodesk (Revit, AutoCAD, Inventor, Navisworks, InfraWorks), Bentley (MicroStation, OpenRoads, STAAD, ProjectWise), Dassault Systèmes (CATIA, SOLIDWORKS, Abaqus, 3DEXPERIENCE), Siemens (NX, COMOS, Star-CD), ANSYS (Mechanical, CFD, SpaceClaim), PTC (Creo, Mathcad), Altair HyperWorks, MSC Software, MathWorks MATLAB and its toolboxes, Hexagon SmartPlant, AVEVA E3D and PDMS, Trimble Tekla, Esri ArcGIS, CSI ETABS and SAP2000, Bluebeam. Plus the long tail that every engineering estate carries and no vendor list ever includes.
Three coverage questions come up in almost every evaluation, so here they are answered directly.
| The question | The answer |
|---|---|
| Can you meter standalone and web-based applications, not just network licenses? | Yes, through a desktop client that measures from application start to stop. Historical reporting by user, group and application is the same. Real-time monitoring is not available for standalone – that requires a networked license. |
| Can you go below the product, to toolboxes, extensions and versions? | Yes where the license manager exposes it, which it does for MATLAB toolboxes on FlexLM. Reporting runs at version level, so two releases of the same product are separate lines. Vendor-specific beyond that. |
| What does the collector do to our servers and our network? | Level 1 reads the license manager rather than instrumenting it: hourly polling at five-minute sample intervals. Desktop clients are only involved where standalone applications are being metered. |
On security, the position is a certificate rather than an assurance: Open iT holds ISO/IEC 27001:2022 certification for information security management, issued by BARR, with scope covering engineering software usage analytics, license entitlement records, enterprise system integrations and user access governance across all products. Deployment is on-premises, so usage data stays in your environment, and user, host and application names can be anonymized reversibly or irreversibly while the usage data stays usable.
07
Explore by workflow domain
Six sub-pages. Each one takes a workflow, its vendors and the licensing shape that causes trouble there.
| Domain | What it covers |
|---|---|
| Building & infrastructure design (BIM) | Autodesk, Bentley, Trimble Tekla. Matching seat and token capacity to project load. Mitta Oy Autodesk-50% story. |
| Structural & civil engineering | CSI, Bentley STAAD and RAM, Autodesk Robot, Oasys GSA. Concurrent analysis-seat optimization. |
| Plant & process (EPC) | AVEVA, Hexagon SmartPlant, AutoCAD Plant 3D, Siemens COMOS. Token models and multi-server consolidation. Aibel 99% story. |
| Simulation & analysis (CAE) | ANSYS, Abaqus, Altair HyperWorks, MSC, MathWorks. Solver and HPC-pack licensing, long-running jobs, seat-holding behaviour. |
| Discrete manufacturing & PLM | Dassault CATIA and SOLIDWORKS, Siemens NX, PTC Creo. Shared workstations, multi-site pools, shift-based demand. |
| Project controls & document management | ProjectWise, BIM 360 and ACC, Bluebeam, plus chargeback. Projektengagemang model. |
08
Frequently asked questions
What is the difference between a license checkout and actual license usage?
A checkout is the license server reserving a seat for a user. It records that the seat is unavailable to anyone else, not that anyone is working in it. Actual usage means measured activity on the host machine – keyboard, mouse, CPU, I/O – correlated against that checkout. The gap between the two is what the Work Ratio Report quantifies, and it is typically 20–40% of an engineering estate at any moment.
How many engineering software licenses do we actually need?
The defensible number is not the peak. It is the count that covered 95% or 99% of measured demand across a full reporting period, which the License Efficiency Report produces per feature. A peak lasting one hour of one day rarely justifies the seats bought to cover it. Twelve months of your own data makes the reduction arguable at renewal rather than assertable.
Can you meter standalone and web-based engineering applications?
Yes. Standalone applications are metered with a desktop client that measures from application start to stop, giving the same historical reporting by user, group, department and application. Real-time monitoring is only available for license-manager-enabled applications, so a standalone estate gets full history but not a live view. Cloud-licensed products are supported where the vendor exposes the data, including Bentley cloud licenses.
Why do we still get license denials when our utilization report shows we are near capacity?
Because both can be true. High utilization counts checkouts, and a seat held idle counts as fully utilised. Denial reason reporting separates the two causes: a genuinely exhausted pool, or seats held concurrently by users who are not working in them. The first is a purchase. The second is a reallocation or a reclamation threshold, and it costs nothing to fix.
How do you report usage when engineers share a single login?
Checkout logs record only the account name, so a shared administrator login makes every user look like one user. Open iT captures the hostname alongside the checkout, and a rename mapping resolves hosts back to named users where each workstation belongs to one person. Where two people share a workstation, no source of information distinguishes them and the report stays at host level.
Can we charge engineering software back to projects and business units?
Yes, provided usage carries organizational structure. Active Directory integration attaches a department, location, cost center or project to every checkout, and collection licenses are translated from raw features back to price-book product names so a bundle can be charged at all. Most firms start with showback while the data accumulates, then move to chargeback once the numbers survive review.
Explore Deeper
Explore by workflow domain
Building & infrastructure design (BIM)
Autodesk, Bentley, Trimble Tekla — matching seat and token capacity to project load.
Structural & civil engineering
CSI, Bentley STAAD and RAM, Autodesk Robot, Oasys GSA — concurrent analysis-seat optimization.
Plant & process (EPC)
AVEVA, Hexagon SmartPlant, AutoCAD Plant 3D, Siemens COMOS — token models and multi-server consolidation.
Project controls & document management
ProjectWise, BIM 360 and ACC, Bluebeam, plus chargeback.