
This video shows a sample report using Open iT to generate heatmaps to monitor software license usage.

Categories

Auxiliary
Supplementary resources, utilities, or tools that enhance core functionality and support various operational needs.
Explore More 
Configuration
Guides and references that help users set up, customize, and optimize system settings to match their specific requirements.
Explore More 
Installation
Explore More
Interface Guides
Step-by-step instructions and visuals explaining how to navigate and use the application’s user interface effectively.
Explore More 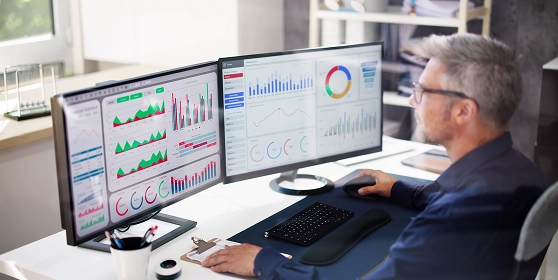
License Managers
Documentation and tools for managing, monitoring, and maintaining software licenses across different systems or products.
Explore More 
Upgrade
Instructions, best practices, and technical guidance for updating Open iT components to newer versions, ensuring a smooth, secure, and efficient transition with minimal downtime.
Explore More