Data is a crucial component in value creation.
Logistics, Marketing & Sales, and HR – organizations can gain insights into the operations of different departments and make informed decisions about how to use their resources for maximum benefit.
This article will focus on how IT departments can use data analysis to optimize software license usage.
Open iT Solutions Consultant Ace Lopez discusses how we apply the four types of data analytics in software license management, lists some challenges faced during software license usage tracking, and provides tips on compelling data storytelling.
The four types of data analytics and how software license management uses them:
Suppose you have tried to search for the different types of data analytics. In that case, most results will point out four major types – descriptive, diagnostic, predictive, and prescriptive analytics.
First, we have descriptive analytics. This type of analysis is considered the least complicated type of analysis.
It provides answers to surface-level questions with a focus on past events. Solutions Consultant Ace Lopez describes this as depicting an organization’s licensing landscape.
The foundation of all other types of analyses, descriptive analytics identifies the reporting parameters set by the organization.
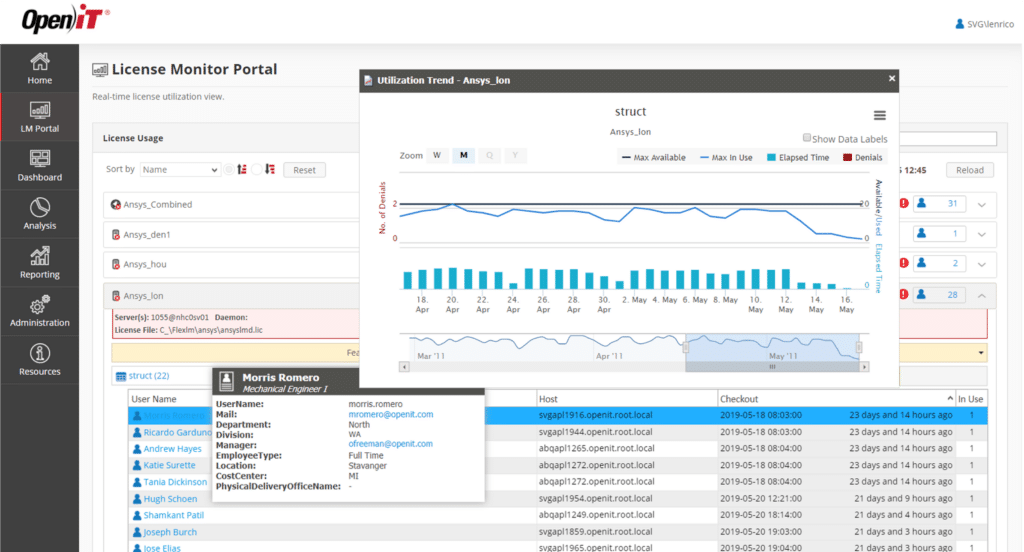
It is also the stage where data filtering is used before any advanced analysis. In Open iT, descriptive analytics is present all over our servers, from the real-time License Monitor Portal to the SQL Server Reporting Services (SSRS) report templates library.
Sample questions that descriptive analytics can answer are how many licenses are currently available for a specific application or which days of the week a department usually experiences a high level of user activity.
The second type of data analytics is diagnostic analytics which aims to answer the root cause of a particular event.
It attempts to answer questions such as why the employees are experiencing license denials and why the chart shows license usage outside working hours. In diagnostic analytics, we cross-check data from different sources.
Collecting data from the license server is insufficient, as it only indicates that the license has been checked-in or checked out.
By relying on just that one source, we cannot uncover how the machine uses the license. Open iT combines the data collected from polling/sampling license usage and accessing logfiles with additional data, such as the vendor’s cost information and mapping data from the client.
As stated by Ace, “The deep granular data that we collect allows us to explore the many forms of data analysis that help us solve software asset management (SAM) problems and improve our practices in many ways.”
Third on the list is predictive analytics. This type of analytics aims to speculate how future events will unfold – just by the name itself.
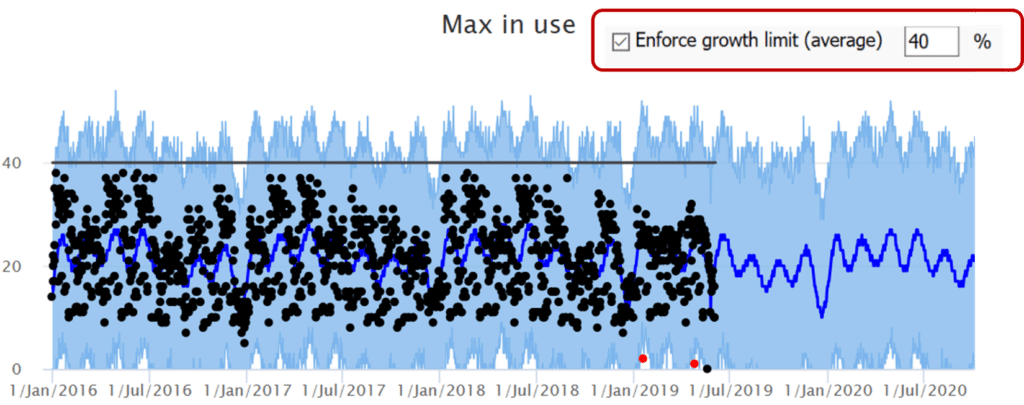
In Open iT, we use predictive analytics to forecast future usage. LicensePredictor, one of the plug-ins for LicenseAnalyzer, uses data mining, predictive modeling, and machine learning to help companies plan for their organization’s predicted license usage over the next 18 months.
The data analyzed by the LicensePredictor can also be used for the early detection of anomalies. An anomaly can either be a usage anomaly or a data anomaly.
Usage anomalies pertain to irregular usage due to user behavior; however, data anomalies occur due to data errors from various causes.
The fourth and last type of data analytics is prescriptive analytics. In this analytics category, we use the gathered data to suggest positive changes to internal policies and licensing decisions.
According to Ace, prescriptive analytics leverages not only the full capability of a SAM tool but also the extensive experience Open iT consultants bring to the table.
Each company’s objectives in its software license management initiative may differ; therefore, the suggested solutions will also vary, e.g., reduce the number of licenses, alter the mix of licensing models, improve user behavior, provide additional application training, etc.
However, the main goal will always remain the same – maximizing the ROI of the company’s software investments.
Three challenges in analyzing data used in optimizing software license usage
An article from Gartner – the IT market reseach company – stated that the annual cost of poor data quality to organizations exceeds $12 million.
It is, therefore, essential to become aware of the different challenges organizations can encounter during the collection, cleaning & normalization, and interpretation of software license usage.
1. Challenges in collecting software license data
One of the challenges mentioned in the previous section is the limit to how much you can parse or poll from a given data source.
It reiterates the need to collect data from multiple sources. However, aside from the source, Ace says that another difficulty organizations face is developing a data collector that can understand and take apart the code used by their vendor.
Most vendors of engineering applications create complicated license files that lead to hard-to-read license usage data. Designing a single custom data collector is hard enough – imagine designing collectors for all your engineering and specialty applications!
For most organizations, developing an in-house tool and creating a dedicated team for this task is not a sustainable activity.
2. Challenges in cleaning and normalizing software usage data
Ace comments that the cleaning and normalization of software license usage data is a question of interpreting multiple versions of, at worst, approximate versions of a single dataset or records of actual events.
He adds that the data we try to analyze is usually initially made only to be stored or read, not nearly to be explored, and less to be used for optimization.
The challenge is really about reading and being familiar with the potential mismatches between datasets before they can be ready for insights and interpretation.
It is also about designing how the data is processed and sorted in that it retains its integrity and flexibility.
3. Challenges in interpreting the collected license usage data
Different factors contribute to the reason why the interpretation of data in the field of software license management is considered challenging.
Some of these factors include the retirement and the introduction of new licensing models, changes in the vendor’s prices, and differences in the requirements of each vendor audit.
Another challenge organizations face the volume of data they receive that needs to be interpreted, which leads some companies to seek assistance from managed service providers.
For example, the data collected by Open iT – we’re talking about license usage drilled down per user, feature, hour, and machine.
This level of granularity requires extensive and in-depth knowledge of the subject to make the most sensible analysis that can be translated into actionable insights.
Three tips on using data storytelling in software license management
We talked about drawing insights from the fruits of your data analysis. However, the value of insights depends on whether the recipient understands their relevance.
Here are some tips on using data storytelling to push your software license management initiatives.
1. Avoid spontaneous visuals.
What are spontaneous visuals?
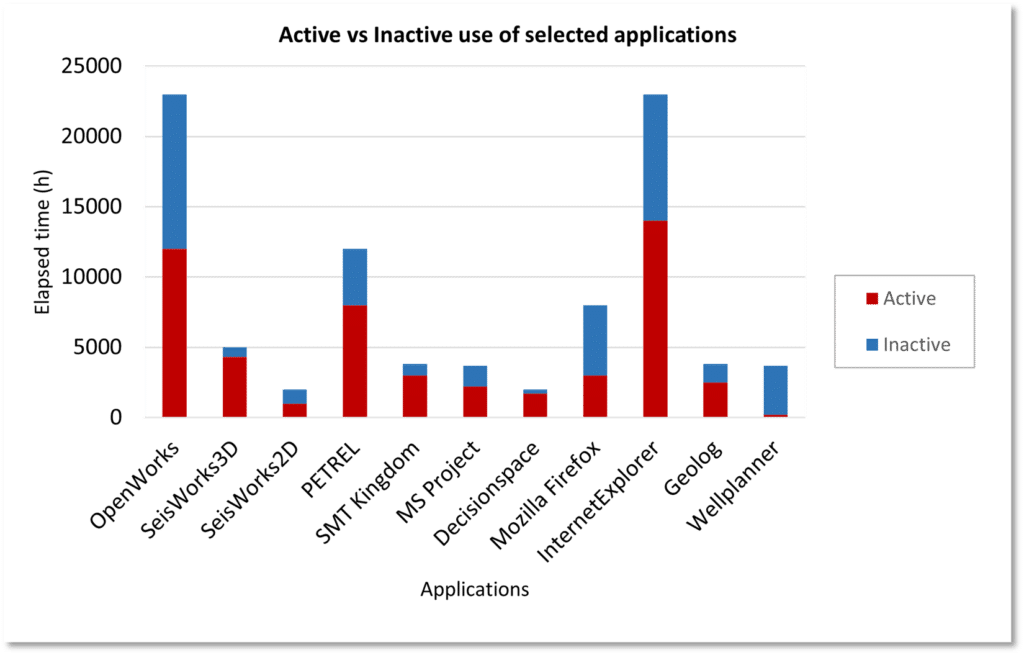
These are unnecessary font styles, font colors, and graphs that distract readers from the actual point that you are trying to make.
Worst case, this can result in misleading data and wrong interpretations. Keep the visuals simple and relevant, similar to the image below.
2. Avoid a poorly constructed narrative.
Ace cautions that a poorly constructed narrative destroys its punchlines and leaves its audience with just snippets of what could have been a unique and valuable story.
Avoid scrunched eyebrows from your audience by ensuring that your presentation follows a logical progression.
Ace adds another tip: customize your language and the details based on whom you’re giving the presentation. If you’re talking to a non-technical decision-maker, provide an overview so they stay focused on the technical jargon.
If you’re talking to someone who knows the ins and outs of their licensing landscape, provide them with specific details that will help them make better-informed decisions.
3. Focus on the bottom line.
Maintain your audience’s attention span by focusing on the things that matter.
Usually, C-level managers are busy, so most are interested in understanding how your suggestions will impact the current and future situation.
Discuss how the proposed changes will impact production levels, show them the cost of taking action or the lack thereof, and discuss how this will affect the organizational culture.
Interested in understanding, manipulating, and interpreting your software license usage data? Get a representative to contact you today.

