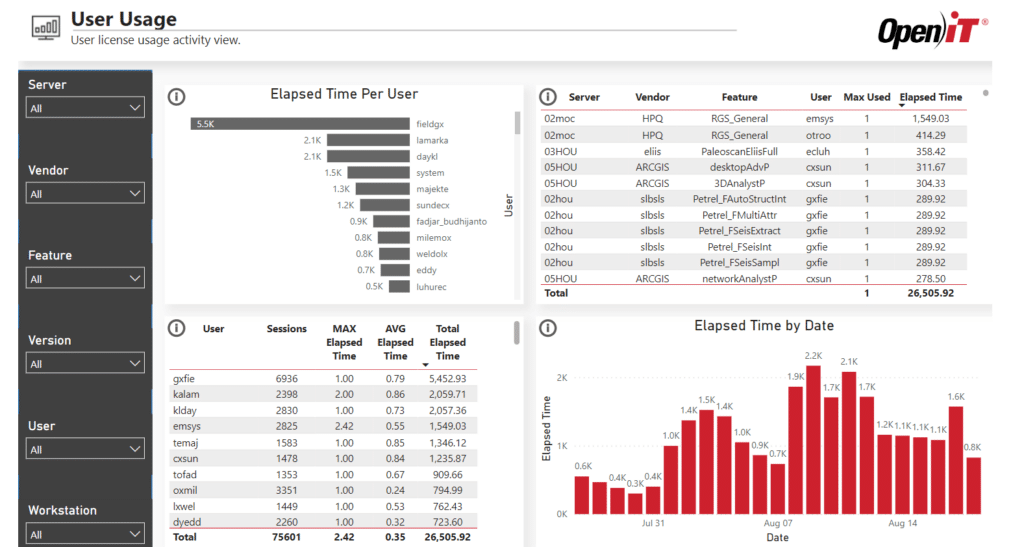
Distributing specific information on license usage across different departments is a common necessity in many companies. Leveraging Power BI significantly streamlines this task. This robust data visualization and analytics tool provides various options to enhance the value of your data, enabling the creation and sharing of customized reports that meet the distinct requirements of different stakeholders.
For example, the report needed by a manager will vary from that required by an engineering department lead. Power BI facilitates easy connection to databases where Open iT aggregates license consumption data from multiple sources. This ensures the production and distribution of appropriate reports to the right individuals, thus improving decision-making throughout the organization.

This guide will walk you through exporting your custom license usage reports via Power BI in a few straightforward steps.
How to Export Reports
To export a report from the Power BI Desktop home screen, click on the File menu located at the top left corner.

This action will display a set of options.
To export, you may choose from the following options:
- Export to PDF: This option creates a PDF file of your report, suitable for printing or emailing to others.
- Power BI template: This exports the current report as a new template.
Publish to Power BI
Another method is publishing your report to the Power BI service, a cloud-based platform that facilitates online report viewing and sharing. Log into the Power BI service using your Microsoft account and select “Publish” from the Power BI Desktop home screen. Once your report is uploaded to the Power BI service, you can access it via a web browser, embed it on a website, or share it with other Power BI account holders. Additionally, you can update the data, schedule refreshes, and set alerts for your report.

Non-Supported Visuals
Certain visuals cannot be exported to PDF, possibly rendering the PDF export option unavailable or absent from the Export dropdown menu:
- Non-certified Power BI custom visuals
- ESRI ArcGIS visuals
- R visuals
- Power Apps visuals
- Python visuals
- Power Automate visuals
- The Paginated report visual
- Visio visuals
- Visuals displayed as a Data point table or with the “Show data point as a table” option
Export Limitations for Reports
- Reports exceeding 50 pages are currently not exportable. This restriction does not apply to paginated reports.
- Reports larger than 500 MB in size.
- Reports owned by a user from a different Power BI tenant domain, such as a report shared with you by someone from another organization, cannot be saved as PDF.
We hope this guide proves helpful in utilizing Power BI to visualize, analyze, and export your historical license usage data.
For more information on Open iT-Power BI integration, contact Open iT.


